On the groundThe numbers your team needs, while there’s still time to act
Most reports arrive the day after, when the crowd has gone home. CrowdSense doesn’t work like that. Occupancy, queue times and movement update live, and reach the people on shift — on their phone, at the gate, in the control room.

Live Queue Times
See queue times at gates and pinch points as they build, so you can open another lane before the wait blows out.

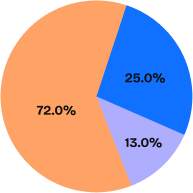
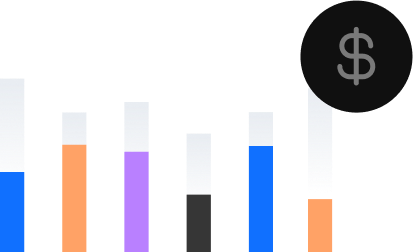
Real-Time Occupancy
Watch occupancy and space use update live, zone by zone, so you can act before a space gets too full.

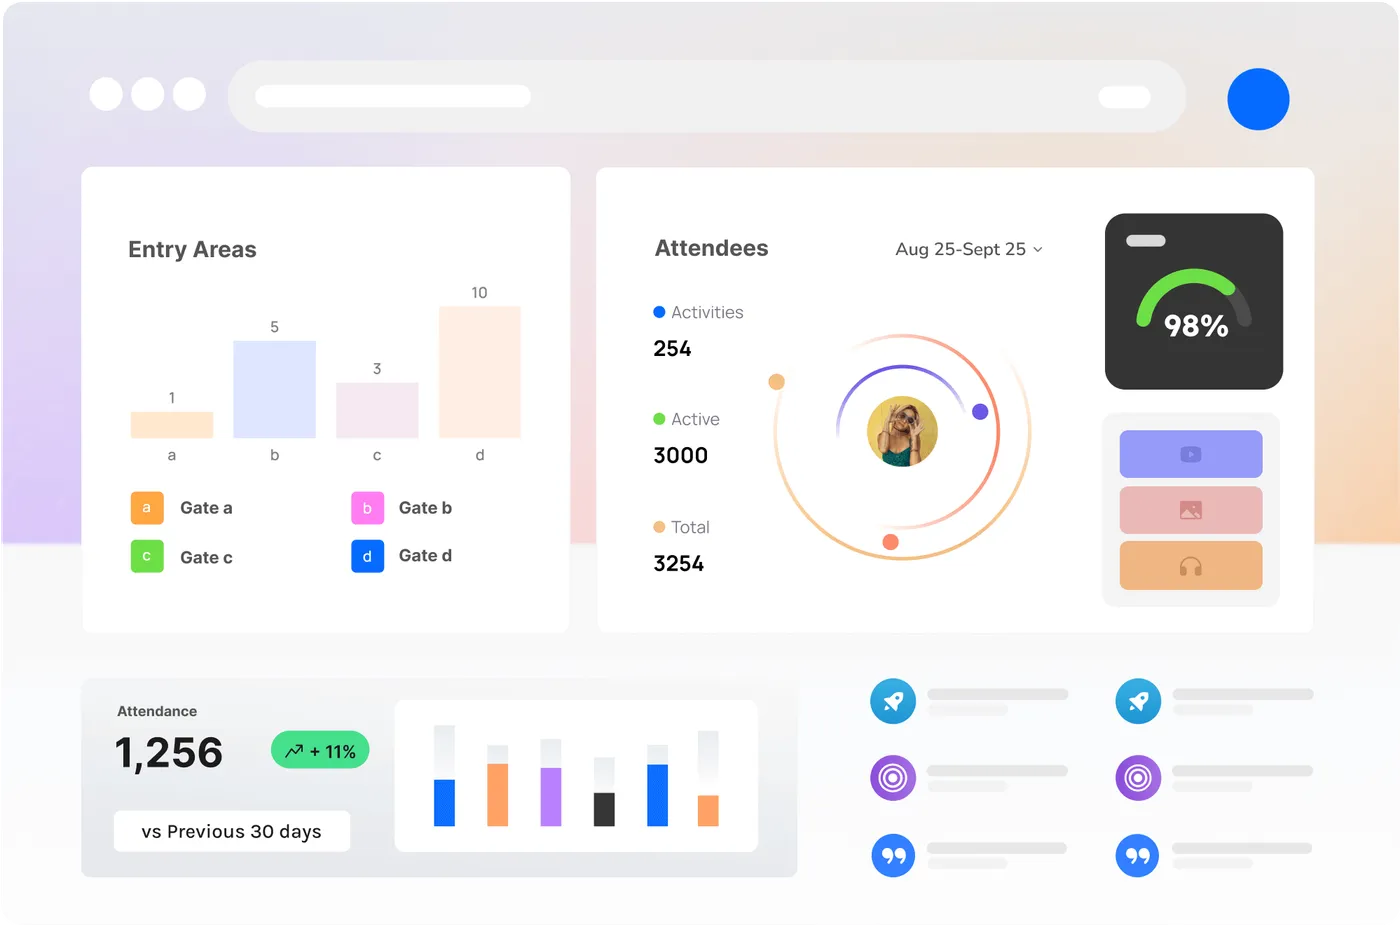
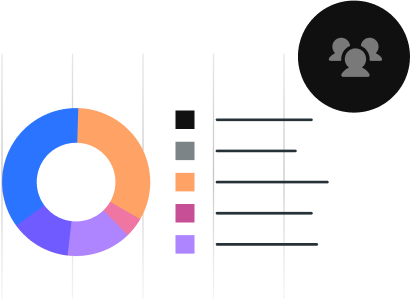
Reporting & Export
Turn the numbers into clear charts and reports your stakeholders and BI tools can use.

 29Jul
29Jul