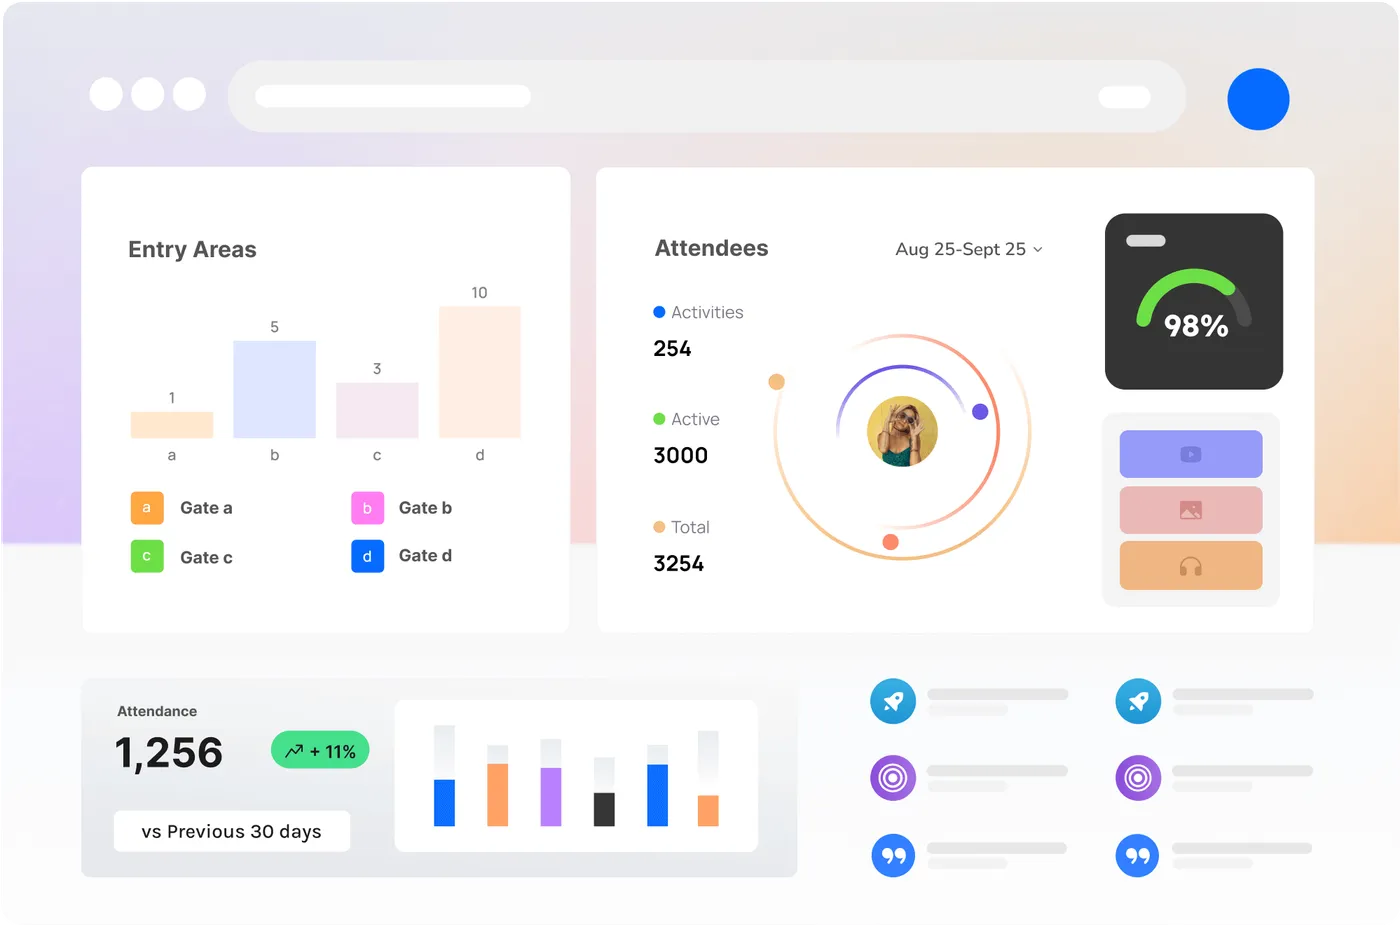
Stand in any control room during a busy event and you’ll hear the same question: where are the people right now? A crowd heatmap answers it at a glance. By colouring a venue map according to how densely occupied each area is, it turns thousands of individual movements into a single, readable picture of pressure across the site.
Density you can see, not guess
CrowdSense builds heatmaps from your existing camera coverage, highlighting hotspots where crowds concentrate and cold zones that sit underused. A choke point forming near a single exit, a thoroughfare that’s narrower than the flow it carries, a vendor row nobody walks down — all of it surfaces visually, in real time, before it becomes a problem.
A tool for safety and for design
In the moment, heatmaps support crowd safety: spot dangerous density early and act before it escalates. Over time, they inform design. If the same corridor reddens every evening, the layout — not the crowd — is the issue. Move a bar, widen a path, reposition signage, and the next heatmap tells you whether it worked.
Make every square metre earn its place
Cold zones are as informative as hot ones. Space that attendees never use is space that could host an activation, a rest area or additional vendors. Heatmaps give event designers an honest read on how their footprint actually performs, so each layout decision is grounded in observed behaviour rather than a hunch on a floor plan.