Event teams run on radios, group chats and a lot of walking. Each carries a different version of what is happening right now, and the debrief afterwards is an exercise in reconciling them. The Control Room replaces that with one shared picture, and the Brain keeps that picture there, and queryable, long after the gates close.
This post explains both, and the third piece that makes them useful: how a measurement gets routed to the person whose job it changes.
Four panes, one screen
The Control Room is software. It runs in a browser, on a video wall, on a laptop in a site office or on a tablet in the back of a truck, and most operators use all three across a single event.
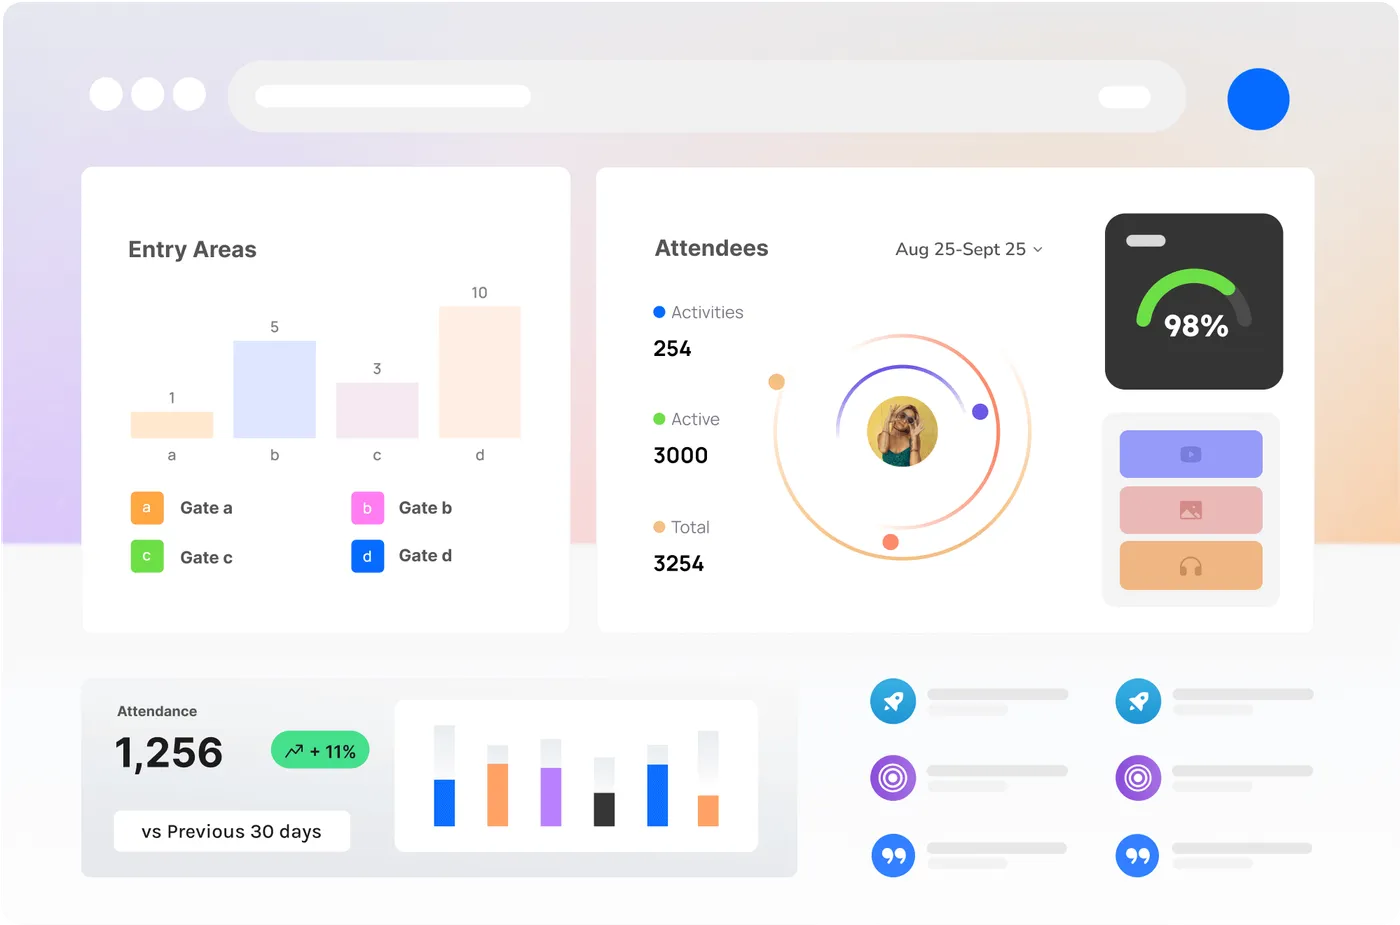
It has four views. Every node, live: counts, occupancy, queues and flow from every Vision Node, Sense Node and connected camera on one map, with thresholds turning a rising number into a visible warning before anyone has to notice it. Every crew member, placed: where your team actually is, checked in through the Companion App or carried across the LoRa mesh where there is no coverage, so you dispatch the closest person rather than the first to answer. Every camera, one wall: Vision Nodes and existing CCTV in a single video wall, where clicking a spiking zone on the map brings its camera to the front. And every screen, one hand: the whole signage network controlled from the same console, including a takeover of every display on site and a one-click return to schedule.
See it, then do something about it
Seeing is half of it. A threshold breach can be routed to a role, a zone or an individual, as a push to the Companion App, an email or a webhook into whatever your team already watches. A one-touch site-wide takeover pushes one message to every screen, every phone and every channel at once, with a log of exactly who was told and when.
Roles keep that from becoming a free-for-all: a sponsor, a caterer and a duty manager each get a different room. And because node data crosses the off-grid mesh and buffers locally, the picture keeps updating when venue wifi and cellular give up.
Every alert, acknowledgement, override and takeover is timestamped automatically, so the incident log becomes a by-product of running the event.
Total recall
When it is over, the whole event is still there. Scrub back to any moment and see what every node saw and every metric said at that second, frosted, so the review is about what happened rather than who was there. Peak occupancy, every threshold breach, every alert and every decision export as a timeline for the after-action review.
Metrics and the decision log are kept for the life of your account, which is what lets you compare this season against last on the same gates, zones and measures. Keyframe imagery has its own retention setting per site, because that is the part with a privacy cost: keep it for a week or a season, your call.
The Brain, and how software reaches it
Under the room sits the Brain: the indexed record of every count, alert and decision, held together so the whole event can be asked a question rather than reconstructed from notes. People reach it through the console; software reaches it two ways.
Pull it through the REST API: live and historical metrics, events, node health and the decision log, over standard HTTPS, returning JSON, authenticated with an API key scoped to your organisation. The same endpoints that feed the Control Room feed your BI stack. Push it through webhooks: subscribe to thresholds, alerts and state changes and have them delivered to ticketing, rostering, comms or your own automation the moment they happen.
Access is scoped per integration, with read and write separated, every call logged and revocation a click away. Read-only is the default; raising an alert or pushing a screen takeover is a write permission granted separately. An MCP surface for AI agents over the same record is designed and on the roadmap; it has not shipped.
A measurement is not information until it arrives
The last piece is routing. A dashboard asks someone to remember to open it, and that does not survive a bad week on site. So every measurement leaves with a destination on it: a named role and the person holding it this week, a trigger, and a channel.
There are seven channels, from the site dashboard and a push to the crew app through scheduled email, SMS, a signed PDF, a webhook and a standing screen on the wall, and five triggers: a schedule, a reading crossing a line, something happening, a milestone, or somebody asking. When nobody acts, one ladder runs on every route: sent, acknowledged in one tap, re-routed to the next name after a window you set, then escalated, with the miss recorded in the monthly report.
The routing map is built with you in a ninety-minute session, wired before commissioning, and tested by firing a real trigger on every route until a real person confirms it arrived. A route nobody confirmed is not commissioned, and a route nobody reads is changed or switched off at the monthly review.
Where to read more
The console is at /platform/control-room, routing at /platform/information-routing and the API and webhooks at /integration. To see your own site on one screen, get in touch.