Dashboards
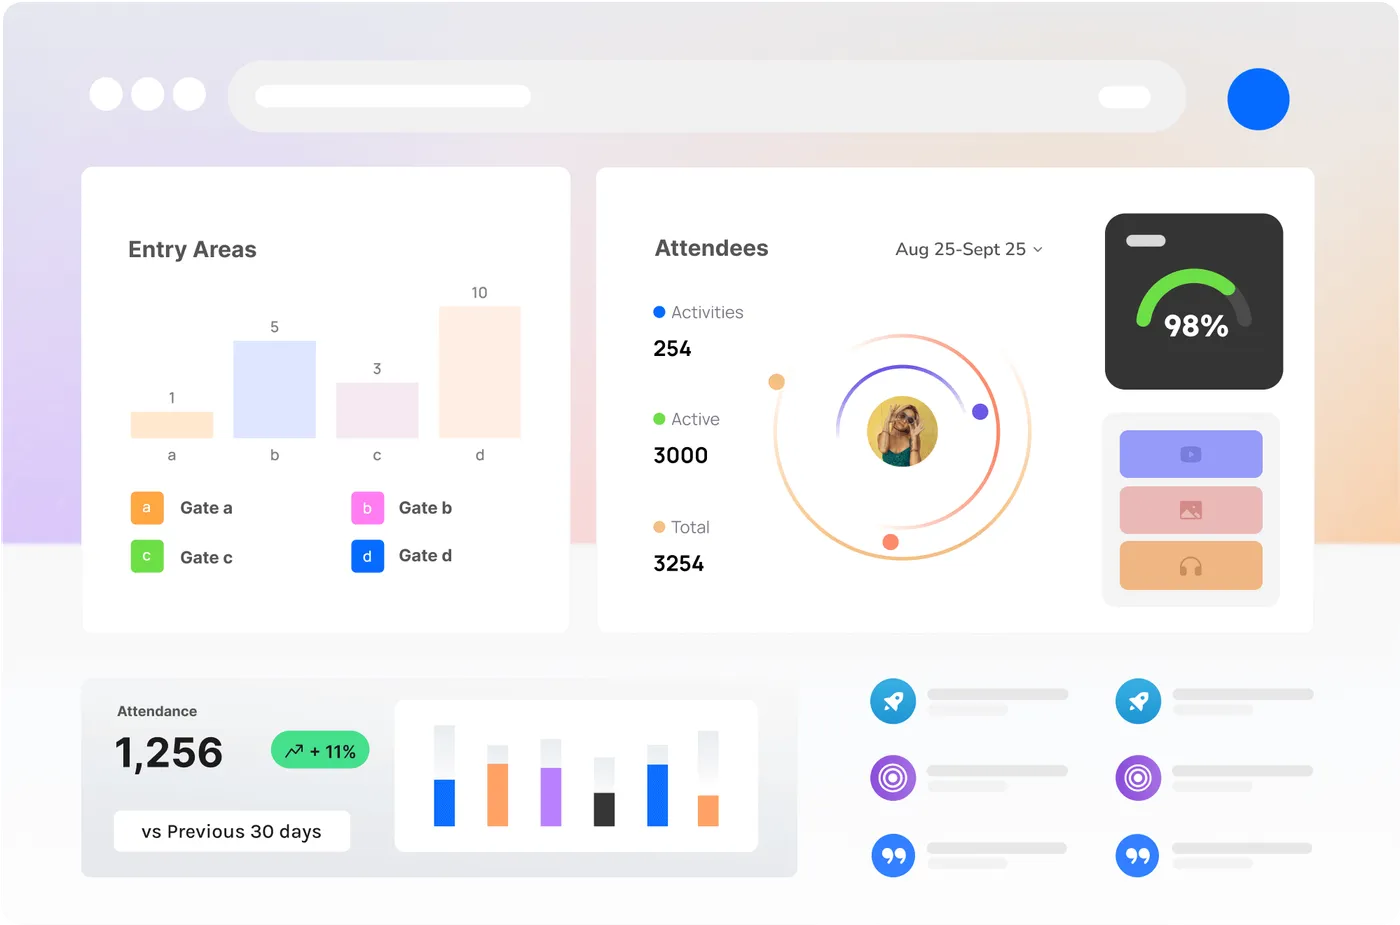
A dashboard is a page of reports in cloud.crowdsense.events. The home page shows your default one.
- Make one per camera, per area or per audience (operations, sponsors, the board), so each person finds their numbers fast.
- Rename, reorder (drag the cards), clone with all its reports, or set as default from the dashboard management page.
- Drag reports between dashboards. A dashboard can be removed once it is empty.
Report types
- Live numbers: current crossings, current occupancy (or vacancy) and current queue, refreshed every few seconds.
- Charts over time: events (compare, sum, a single total line, or percent of total), activity (total time spent in a zone), occupancy history, queue history, speed, trajectory, and conversions (visitors against your own figures, such as sales).
- Distributions: density (how many were in a zone, and for how much of the time), dwell time, vehicle classes, and people gender and age.
- Heatmaps: where movement concentrated in each camera’s view, on a linear or logarithmic scale; group cameras covering one room so their colours compare fairly.
- Hourly and daily patterns: activity by hour and day of the week.
Most chart reports can be single-period, or multi-period to compare (for example) today with the same day last week.
Add a report
- 1
Choose Add report
Pick single or multi-period, then the report type.
- 2
Name it clearly
For example “People in through Gate 2 today”. The name is what people see on the dashboard.
- 3
Set the period and step
Today, last week or a custom range; the step (hour, day, week) adjusts to suit. Add a time filter to look only at, say, 8 am to 11 am.
- 4
Add series
Each series is a location, camera, line or zone, and an event type, with its own name and colour.
- 5
Leave the class filter alone at first
Filtering to people or a vehicle type changes results a lot. Use it only when the profile and lines are set up for it.
Edit, clone and expand
Every report’s menu (the three dots) has edit, clone, export, share, remove and expand to full width. Drag a report by its title to move it.
How long history is kept
The portal keeps three months of event history by default. Event pass dashboards stay readable for 3 months after the event. If you need longer, for example to compare with last year, write to support@crowdsense.events before the three months run out.
Still stuck?
Email support@crowdsense.events with your account reference (it starts CS-D-), the computer’s name and a screenshot of what you see. For sales questions, contact us.